

BCPS 2013: Statistics
/ This is a collection of reviews that I have found across the web to help you on your journey of obtaining the BCPS certification (along with me, of course). I don't know about you but statistics as a class was not my favorite. In fact, I believe that I am not cut out for the left-brained thinking that statistics require. HOWEVER, I feel that I had a MAJOR grasp on the statistics portion of the test in 2012 and yes... statistics is on there in a big way. (Don't let anyone kid you though, don't forget regulations and pharmacoeconomics like I did).
This is a slide handout from Tony Gerlach, PharmD, BCPS
This is a collection of reviews that I have found across the web to help you on your journey of obtaining the BCPS certification (along with me, of course). I don't know about you but statistics as a class was not my favorite. In fact, I believe that I am not cut out for the left-brained thinking that statistics require. HOWEVER, I feel that I had a MAJOR grasp on the statistics portion of the test in 2012 and yes... statistics is on there in a big way. (Don't let anyone kid you though, don't forget regulations and pharmacoeconomics like I did).
This is a slide handout from Tony Gerlach, PharmD, BCPS
Dr. Ted Williams has a study guide here.
So first, you want to know the type of data you are dealing with. How much (quantitative) vs. what type (categorical) data?
Quantitative variables can be continuous or discrete. Continuous variables, such as weight, can in theory take any value within a given range. Examples of discrete variables are: number of kids in a family, number of attacks of COPD per year.
Categorical variables are either nominal (unordered) or ordinal (ordered). Examples of nominal variables are male/female, alive/dead, blood type O, A, B, etc.
The key for nominal variables with more than two categories is that the order does not matter. For example, one cannot say that people in blood type A lie between those in A and O. Sometimes, however, people can provide ordered responses, such as grade of colon cancer. In this case the order does matter and it is usually important to account for it.
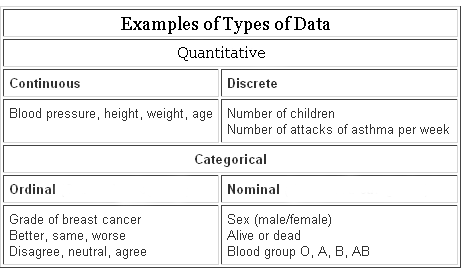
You could turn blood pressure measurements into nominal data by listing hypotension, normotensive, or hypertensive. Height (continuous) could be changed by short, average, or tall. Get it?
By this point you should understand what MEDIAN, MEAN, and MODE.
Mean is the average of all.
Median is the middle point in relation to mean points.
Mode is the most common data point.
Let's go deeper.
The mean is what we all know. The average. It is affected by changing data points. A major disadvantage of the mean is that it is sensitive to outlying points.
The median is known as a measure of location; it tells us where the data are. The value of the median isn't changed by making the smallest data point smaller and largest point larger. It is LESS efficient in that it does not include all the information of the data. JUST the middle point.
The range is an important measurement because it tells you the top and bottom of the data points. However, they do not give much indication of the spread of observations about the mean. This is where the standard deviation (SD) comes in.
More later...
Have some better info? Have some better links on learning stats? Comment here!